Using New Relic in a Rack app
- rack
- ruby
I recently switched this blog from a full-on Rails 3 app to Toto, which is a Rack based blog app implemented in fewer than 300 lines of Ruby. I had New Relic enabled in my Rails 3 blog, so I figured it would be pretty easy to integrate it with a Rack app too. Just flip a switch, right? Well, not quite - in this post, I’ll go through the process of adding detailed New Relic instrumentation to a Rack app.
Getting started
New Relic does have some documentation for Rack app integration, but it doesn’t buy you a whole lot. Going with the suggestion for Rack apps from their documentation, I added the following to Toto’s rackup file:
require 'newrelic_rpm'
require 'new_relic/agent/instrumentation/rack'
Toto::Server.class_eval do
  include NewRelic::Agent::Instrumentation::Rack
end
I’m deploying this application to heroku, with the New Relic heroku add-on installed (it will warn about rails not being
present when you deploy; just ignore that and make sure you have gem 'newrelic_rpm' in your Gemfile), which is particularly
convenient because the heroku add-on will set some environment variables to configure New Relic (in the absense of the config/new_relic.yml
file that would normally be present in a Rails app). It is possible to specify the file path or start New Relic with specific
settings - there’s an example of the latter in the Developer Mode section of this post - if you aren’t using heroku.
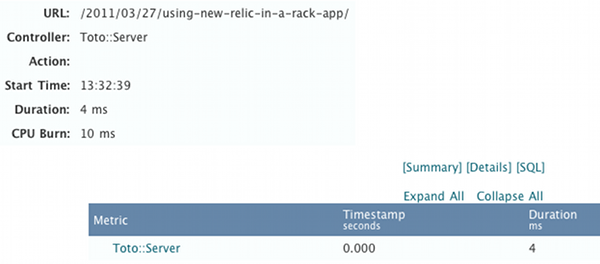
After deploying, I fired up a few requests to various routes, waited a bit, then checked New Relic. Whatchya got for us NR?
Okay… well that’s not exactly useful. We see all of our time being spent in the Toto::Server app - regardless of the page being viewed -
but at least we know it’s working, right? Checking out the comments on module Rack in new_relic/agent/instrumentation/rack.rb,
we can find a slightly more detailed suggestion
# New Relic will instrument a #call method as if it were a controller
# action, collecting transaction traces and errors.  The middleware will
# be identified only by it's class, so if you want to instrument multiple
# actions in a middleware, you need to use
# NewRelic::Agent::Instrumentation::ControllerInstrumentation::
#     ClassMethods#add_transaction_tracer
Hey, yeah, that’s exactly what we want to do: “instrument multiple actions”. Let’s add some transaction tracers in our rackup file, so now we’ll have:
require 'newrelic_rpm'
require 'new_relic/agent/instrumentation/rack'
require 'new_relic/agent/instrumentation/controller_instrumentation'

Toto::Server.class_eval do
  include NewRelic::Agent::Instrumentation::Rack
end

[ Toto::Archives, Toto::Article, Toto::Repo ].each do |toto_klass|
  toto_klass.class_eval do
    include NewRelic::Agent::Instrumentation::ControllerInstrumentation
    add_transaction_tracer :to_html
  end
end
…and the results are… no change. Hmm, at this point, to see the results of my changes I need to: deploy; run apache bench; wait a few minutes for results to show up in New Relic; then repeat. This process is definitely not optimal for tweaking and debugging what’s going on, so it’s time for a detour.
Developer Mode
New Relic has a local developer mode that I’ve found extremely useful when I need to add some extra resolution to Rails instrumentation (e.g. instrumenting sphinx search calls). Developer mode is another one of those “just works on Rails” features of New Relic, but we can turn it on for an arbitrary Rack app pretty easily. In our rackup file:
if Toto.env == 'development'
  require 'new_relic/control'
  NewRelic::Control.instance.init_plugin 'developer_mode' => true,
                                         :env => Toto.env

  require 'new_relic/rack/developer_mode'
  use NewRelic::Rack::DeveloperMode
else
  require 'newrelic_rpm'
end

require 'new_relic/agent/instrumentation/rack'
require 'new_relic/agent/instrumentation/controller_instrumentation'

Toto::Server.class_eval do
  include NewRelic::Agent::Instrumentation::Rack
end

[ Toto::Archives, Toto::Article, Toto::Repo ].each do |toto_klass|
  toto_klass.class_eval do
    include NewRelic::Agent::Instrumentation::ControllerInstrumentation
    add_transaction_tracer :to_html
  end
end
Now we can make some requests, then check /newrelic to see a local version of New Relic. Before we move on, there
are a couple important bits to take note of here:
-
Make sure you aren’t using shotgun as your development server. It has the nice property (for iteration) of reloading completely on every request, but that also makes New Relic developer mode lose all recorded data on each request. New Relic will also display a warning about threading if you use unicorn, so you probably want to stick to thin or mongrel.
-
Notice the custom configuration when initializing New Relic, which is necessary when not running on heroku. heroku sets a couple environment variables that New Relic reads on start up, so we need to configure New Relic ourselves when running locally.
Now that we have developer mode enabled, we can make a few requests, then go to localhost:3000/newrelic to get a listing
of the requests that have been traced:
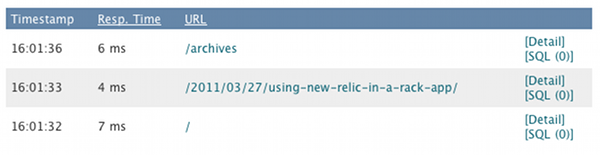
Viewing the details, we can see the same information from the New Relic site, albeit with a slightly different presentation:
We can view these details immediately after each request, so this will make rapid iteration on our New Relic instrumentation a lot easier.
Back to instrumentation
Now that we can easily iterate on our New Relic instrumentation, a little digging around in Toto’s source reveals that
the Toto::Site::Context#render method is essentially our action dispatch - not the to_html that we were trying to
instrument before. We want to instrument render, with the name of the page being rendered (“article”, “archives”, etc)
as the action name:
Toto::Site::Context.class_eval do
  include NewRelic::Agent::Instrumentation::ControllerInstrumentation

  add_transaction_tracer :render, :name => '#{args.first.to_s}'
end
New Relic transaction and method tracer names are conveniently evaluated in the context of the function being traced -
in this case, Toto::Site::Context#render(page, type) - but the function they are evaluated in takes the arguments as *args,
so we need to know that the first argument - page - is the one we are interested in using as the name of the action.
Alright, now let’s see what developer mode has for us. Looking at a developer mode trace of an article view request:
There we go! Now we are getting somewhere; Toto::Server is still the entry point for our Rack instrumentation, but
now we have our specific action showing up. The key is that the transaction tracer added to the render function helps
New Relic by giving it some specific knowledge about what Toto is doing. For instance, a request for the index
page of our Toto application will show up as:
Adding resolution
We’ve given New Relic a bit more info about what is going on, but it’s still pretty opaque as to where the time
is being spent, so let’s see what we can do about that. We traced the equivalient of a Rails controller action -
Toto’s render method - so now we will add finer grained instrumentation with method tracers.
Poking around in Toto’s source again, we can find a smattering of methods that might be doing some work:
Toto::Site.class_eval do
  include NewRelic::Agent::MethodTracer
  add_method_tracer :index
  add_method_tracer :archives
  add_method_tracer :article
  add_method_tracer :/
  add_method_tracer :go
end

Toto::Site::Context.class_eval do
  include NewRelic::Agent::MethodTracer
  add_method_tracer :initialize
  add_method_tracer :render
  add_method_tracer :to_xml
end
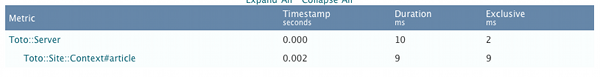
Now we can see where these methods fit into the trace:
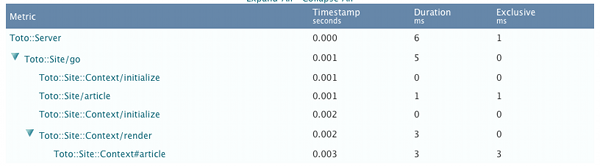
We’ve made some progress, but we still have half of our time being spent in the #article action. Toto
renders ERB templates, so let’s drop the Toto::Site::Context method tracers that didn’t add much info, and add some more
relevant method tracers. Toto renders ERB templates in that to_html method we originally tried to instrument, so
we’ll want to trace the pertinent ERB methods. We can get a little more context on which ERB template is being processed
by tracing the to_html method, since it actually knows which ERB template is being loaded.
ERB.class_eval do
  include NewRelic::Agent::MethodTracer
  add_method_tracer :initialize
  add_method_tracer :result
end

# to_html comes from the Toto::Template module, which is included in
# each of the following classes
[Toto::Site::Context, Toto::Repo, Toto::Archives, Toto::Article ].each do |klass|
  klass.class_eval do
    include NewRelic::Agent::MethodTracer
    add_method_tracer :to_html, 'Custom/#{self.class.name}/to_html/#{args.first}'
  end
end
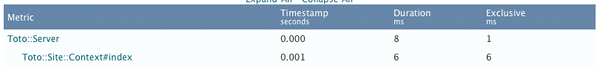
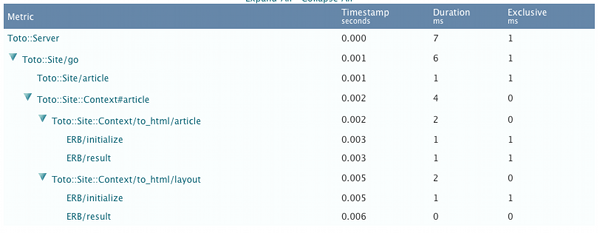
We’ll make use of New Relic’s evaluation of the metric name in the context of Toto::Template#to_html(page, config, &blk)
to capture the first argument - the page name - as the template that is being rendered. Now we have a much clearer view
of what is going on:
We can see a corresponding breakdown in New Relic’s web interface (with some slightly different relative numbers, since this is pulled from the heroku deployed version):
Well then
Now that we have our Rack app all measured out, it’s plain to see that it is pretty damn fast. Hardly in need of instrumentation, but it does provide a nice - and relatively simple - test case for setting up detailed New Relic instrumentation.